HR Analytics of Transit Agency Employee Survey (2023)
Human Resource Analysis, People Analysis, Statistical Testing, Power BI dashboarding
Project Overview
In 2023, I conducted an HR analytics project for a transit agency to analyze survey data from 1498 employees. The dataset included demographic details (e.g., age, salary, tenure), survey responses on constructs like engagement, motivation, and leadership (measured on Likert scales), and behavioral metrics like tardiness and safety incidents. The goal was to answer specific questions to test hypotheses and uncover relationships between variables to inform HR strategies, such as improving employee retention and engagement.
I used Python with libraries like pandas, scipy, statsmodels, and factor_analyzer to perform statistical analyses. Below, I detail each question, the rationale for the analysis, the methodology, and the results.
First things than managers wanted to kno was " What is the range of Age (Column D) in years?". the Purpose of this question was provides insight into the demographic diversity of the workforce, which is useful for tailoring HR policies to different age groups.
I removed missing values from the “Age” column using pandas’ dropna() function and calculated the range by subtracting the minimum age from the maximum age.
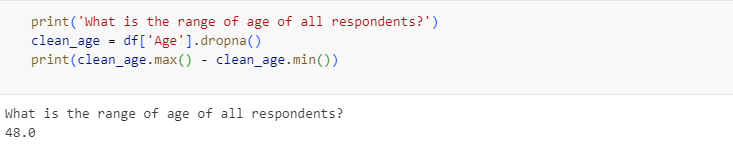
As the Result the age range was 48 years. This wide range suggests a multigenerational workforce, requiring HR strategies that address varied needs, such as career development for younger employees and retirement planning for older ones.
Net Promoter Score (NPS)
Next important question for managers was "What is the Net Promoter Score (NPS) for all survey respondents?"
Purpose of this question was calculate The Net Promoter Score (NPS) measures employees’ likelihood to recommend the organization, serving as an indicator of overall employee satisfaction and loyalty.
NPS is calculated as the percentage of promoters (scores 9–10 on “How likely is it that you would recommend the Transit Agency to a friend or colleague?”) minus the percentage of detractors (scores 0–6). I used pandas to compute the proportion of promoters and detractors and then calculated the difference.
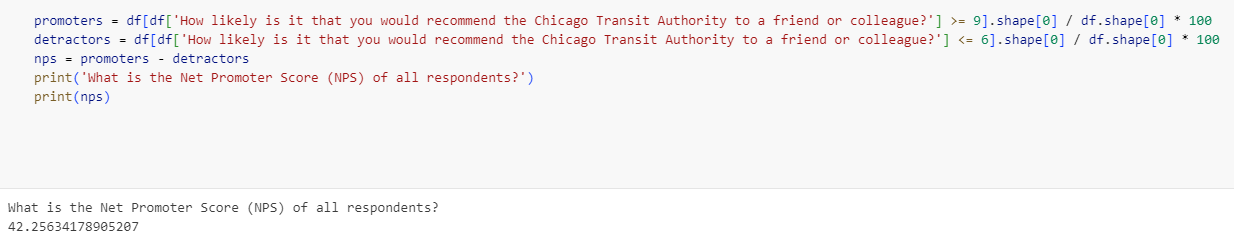
I calculated The NPS was 42.26. This positive score indicates that more employees are promoters than detractors, suggesting moderate to high satisfaction, though there is room for improvement to reach best-in-class benchmarks (typically NPS > 50).
Bivariate Correlation Analysis
I the next step i did Bivariate Correlation Analysis of Survey Items (Columns J:AT) with Stay Intention (Column BF). the Purpose was Identifying which survey items (e.g., satisfaction, engagement) most strongly correlate with stay intention helps pinpoint factors influencing employee retention, guiding targeted interventions.
I conducted a bivariate correlation analysis using scipy’s pearsonr function to compute Pearson correlation coefficients (r) and p-values between each survey item (columns J:AT) and “Stay Intention: I plan on working here for another (in years):”. I filtered for statistically significant correlations (p < 0.05) and selected the top three variables based on the absolute magnitude of r.
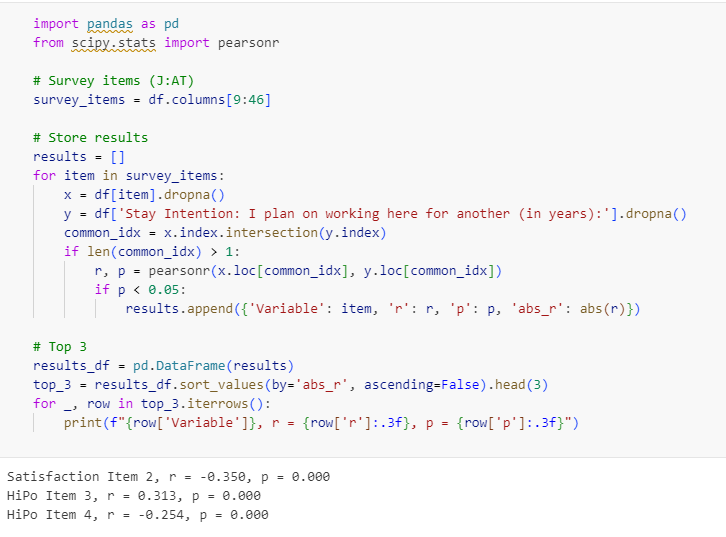
The three variables with the greatest correlation with stay intention were:
Satisfaction Item 2: r = -0.350, p = 0.000
HiPo Item 3: r = 0.313, p = 0.000
HiPo Item 4: r = -0.254, p = 0.000
These results suggest that satisfaction and high-potential traits (self-efficacy and drive) significantly influence employees’ plans to stay, with Satisfaction Item 2 showing a notable negative correlation, possibly indicating reverse-coded items or dissatisfaction driving lower stay intention.
T-Test
the next task was conducting T-Test for Support "Item 1" variable by "Manager Status" variable.
This analysis tests whether managers and non-managers differ significantly in their perceptions of organizational support, which can inform leadership training or support programs.
I used scipy’s ttest_ind to perform an independent samples t-test comparing “Support Item 1” scores between managers (“Are you a manager or above?” = “YES”) and non-managers (“NO”). I first checked for equal variances using Levene’s test (p > 0.05 indicates equal variances) to determine the appropriate t-test parameters. A p-value < 0.05 indicates a significant difference.
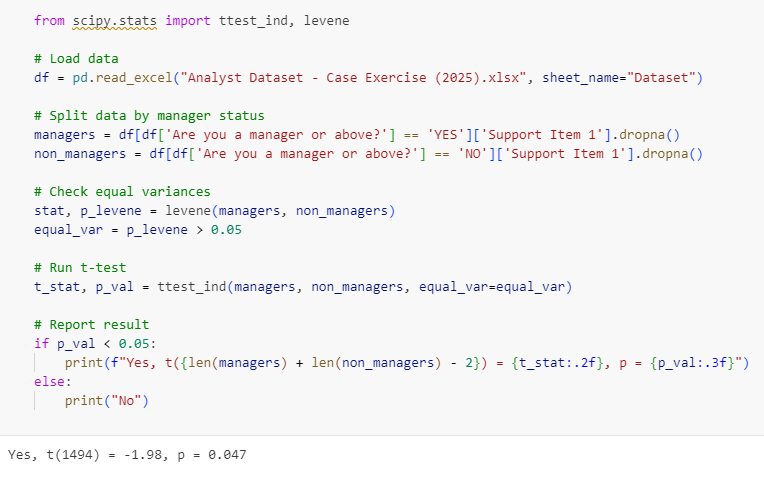
There was a statistically significant difference: t(1494) = -1.98, p = 0.047. This suggests that managers and non-managers have different perceptions of organizational support, with the negative t-statistic indicating that non-managers may perceive less support, warranting further exploration.
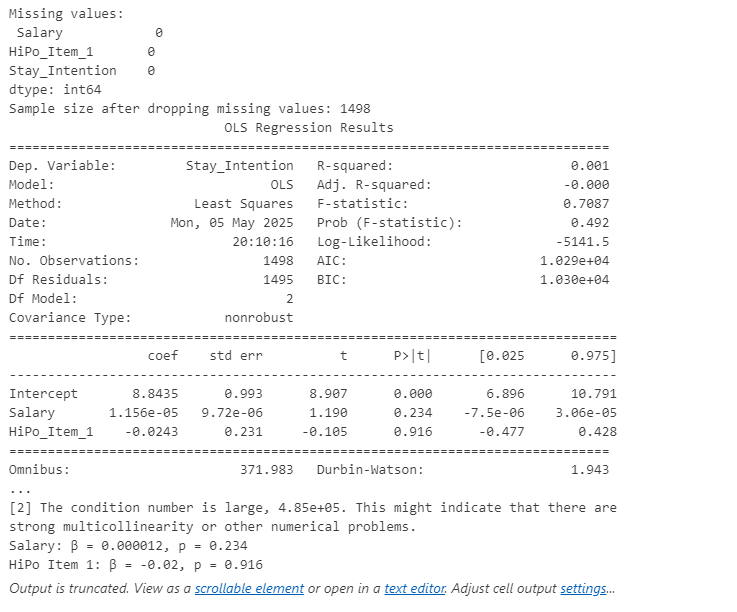
OLS Regression
My next task was impliment OLS Regression with "Salary" and "HiPo Item 1" as Predictors of Stay Intention. This regression analysis examines how salary and perceived self-efficacy (HiPo Item 1) predict employees’ intention to stay, helping to quantify the impact of compensation and personal drive on retention.
I used statsmodels’ smf.ols to run an ordinary least squares (OLS) regression with “Stay Intention: I plan on working here for another (in years):” as the dependent variable and “What is your yearly company salary?” and “HiPo Item 1” as predictors. I cleaned the data by removing non-numeric characters (e.g., “$”) and missing values, then reported the unstandardized beta coefficients and p-values.
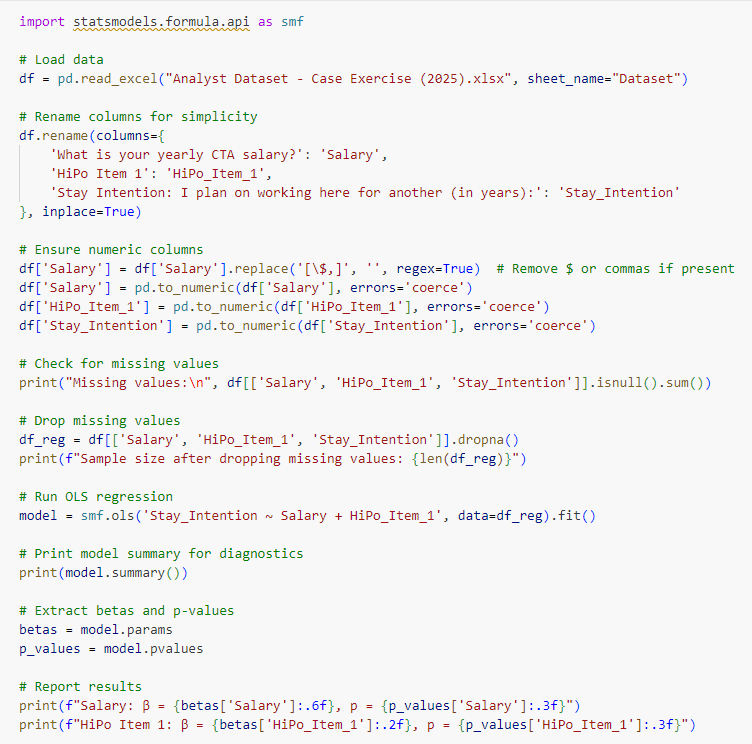
Result
Salary: β = 0.000012, p = 0.234
HiPo Item 1: β = -0.02, p = 0.916
Neither predictor was statistically significant (p > 0.05), and the model’s R-squared was low (0.001), indicating that salary and HiPo Item 1 explain little variance in stay intention. This suggests other factors may be more influential in predicting retention.
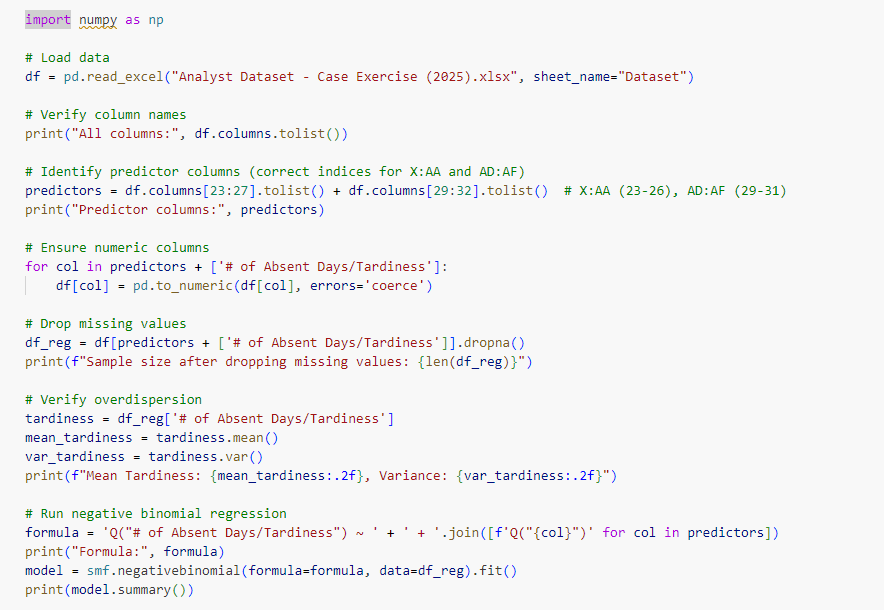
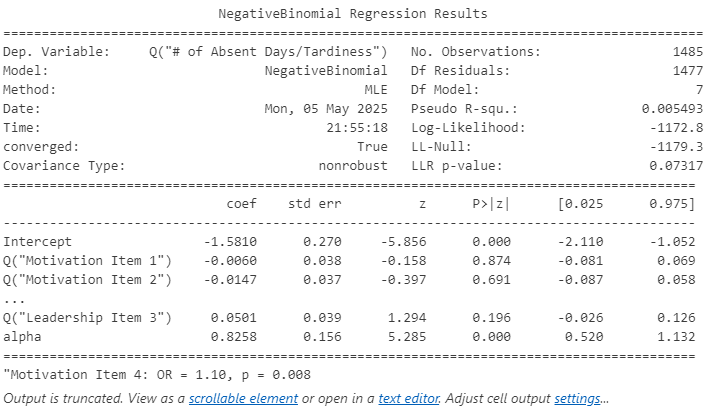
Negative Binomial Regression
In the next step I implimented Negative Binomial Regression with "Motivation" and "Leadership" Items Predicting "Tardiness"
Tardiness (absent days or late arrivals) is a count variable, and understanding its predictors (motivation and leadership perceptions) can help address absenteeism, a key HR concern.
Given the count nature of “# of Absent Days/Tardiness” and potential overdispersion (variance > mean), I used statsmodels’ negativebinomial to model the relationship with Motivation Items (X:AA) and Leadership Items (AD:AF) as predictors. I verified overdispersion by comparing the mean (0.37) and variance (0.60) of tardiness. I reported odds ratios (OR) and p-values for significant predictors (p < 0.05).
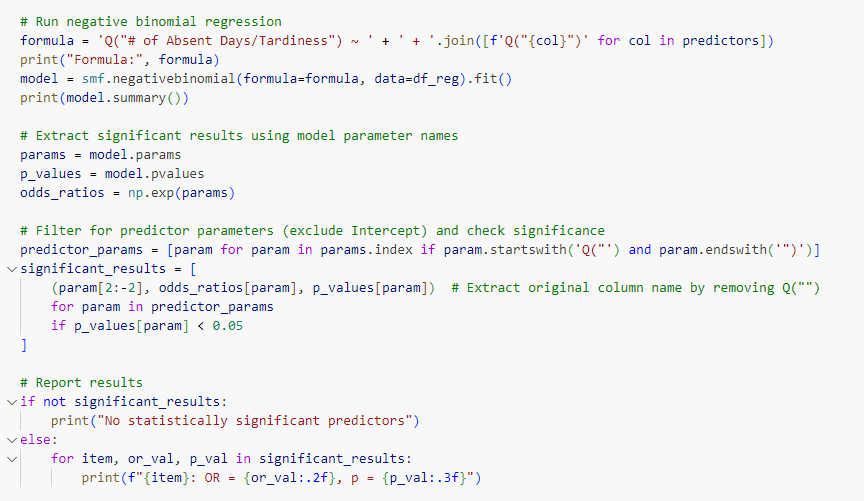
Result
The only statistically significant predictor was:
Motivation Item 4: OR = 1.10, p = 0.008
This indicates that a one-unit increase in Motivation Item 4 (e.g., task autonomy) increases the expected count of tardiness incidents by 10%, suggesting a complex relationship that may require further qualitative investigation.
All columns: ['Respondent ID', 'What is your gender?', 'What is your race or ethnicity?', 'Age', 'What is your yearly companysalary?', 'companyTenure (Months) ', 'At which location do you work?', 'What is your Position?', 'Are you a manager or above?', 'Fit Item 1', 'Fit Item 2', 'Fit Item 3', 'HiPo Item 1', 'HiPo Item 2', 'HiPo Item 3', 'HiPo Item 4', 'Satisfaction Item 1 ', 'Satisfaction Item 2', 'Engagement Item 1', 'Engagement Item 2', 'Engagement Item 3', 'Engagement Item 4', 'Engagement Item 5', 'Motivation Item 1', 'Motivation Item 2', 'Motivation Item 3', 'Motivation Item 4', 'Performance Item 1', 'Performance Item 2', 'Leadership Item 1', 'Leadership Item 2', 'Leadership Item 3', 'Support Item 1', 'Support Item 2', 'Commitment Item 1', 'Commitment Item 2', 'Commitment Item 3', 'Commitment Item 4', 'Commitment Item 5', 'Diversity Item 1', 'Diversity Item 2', 'Diversity Item 3 (Reverse Coded)', 'Trust Item 1', 'Trust Item 2', 'Coworker Item 1', 'Coworker Item 2', 'Satisfaction Rank: Communication', 'Satisfaction Rank: Compensation', 'Satisfaction Rank: Coworkers/Peers', 'Satisfaction Rank: Management', 'Satisfaction Rank: Organizational Fit', 'Satisfaction Rank: Career Opportunity', 'Satisfaction Rank: Work Environment', 'Satisfaction Rank: Clear Job Expectations', 'Satisfaction Rank: Other (specify below)', 'How likely is it that you would recommend the Chicago Transit Authority to a friend or colleague?', 'Stay Intention: I am actively seeking another job in a different company/organization.', 'Stay Intention: I plan on working here for another (in years):', 'Stay Factor: Quality of Management', 'Stay Factor: Career Development', 'Stay Factor: Pay/Salary', 'Stay Factor: Coworker Relationships', 'Stay Factor: Grievance Handling', 'Stay Factor: Job Satisfaction', 'Stay Factor: Challenging Work', 'Stay Factor: Rewards & Recognition', 'Stay Factor: Safety', 'Stay Factor: Workload', '# of Safety Incidents', '# of Absent Days/Tardiness']
Predictor columns: ['Motivation Item 1', 'Motivation Item 2', 'Motivation Item 3', 'Motivation Item 4', 'Leadership Item 1', 'Leadership Item 2', 'Leadership Item 3']
Sample size after dropping missing values: 1485
Mean Tardiness: 0.37, Variance: 0.60
Formula: Q("# of Absent Days/Tardiness") ~ Q("Motivation Item 1") + Q("Motivation Item 2") + Q("Motivation Item 3") + Q("Motivation Item 4") + Q("Leadership Item 1") + Q("Leadership Item 2") + Q("Leadership Item 3")
Optimization terminated successfully.
Current function value: 0.789793
Iterations: 18
Function evaluations: 21
Gradient evaluations: 21
Exploratory Factor Analysis (EFA)
My next responsibility in this project was doing Exploratory Factor Analysis (EFA) on "Engagement Items". EFA was used to assess whether the five Engagement Items (S:W) form a cohesive measure of employee engagement and identify items that could be dropped to improve the construct’s reliability for future surveys.
I conducted EFA using the factor_analyzer package with principal axis factoring, one fixed factor, and varimax rotation (though rotation is irrelevant for one factor). I evaluated:
KMO Test: Kaiser-Meyer-Olkin measure (KMO > 0.6 indicates sampling adequacy).
Bartlett’s Test: Tests for sufficient correlation among items (p < 0.05).
Factor Loadings: Items with loadings < 0.4 are candidates for removal.
Communalities: Proportion of each item’s variance explained by the factor (low communalities < 0.2 suggest poor fit).
Result:
KMO: 0.587 (slightly below the ideal threshold, suggesting marginal adequacy).
Bartlett’s Test: chi-square = 441.73, p = 0.000 (indicating sufficient correlation).
Factor Loadings:
Engagement Item 1: -0.107
Engagement Item 2: -0.273
Engagement Item 3: -0.680
Engagement Item 4: -0.776
Engagement Item 5: -0.696
Communalities:
Engagement Item 1: 0.011
Engagement Item 2: 0.075
Engagement Item 3: 0.463
Engagement Item 4: 0.603
Engagement Item 5: 0.485
Variance Explained: Factor 1 explained 32.7% of the variance.
Items to Drop: Engagement Item 1 (loading = -0.107, communality = 0.011) and Engagement Item 2 (loading = -0.273, communality = 0.075) should be considered for removal due to low loadings (< 0.4) and communalities (< 0.2). These items do not strongly contribute to the engagement construct, suggesting they may measure unrelated aspects or be poorly worded.
All columns: ['Respondent ID', 'What is your gender?', 'What is your race or ethnicity?', 'Age', 'What is your yearly salary?', 'Tenure (Months) ', 'At which location do you work?', 'What is your Position?', 'Are you a manager or above?', 'Fit Item 1', 'Fit Item 2', 'Fit Item 3', 'HiPo Item 1', 'HiPo Item 2', 'HiPo Item 3', 'HiPo Item 4', 'Satisfaction Item 1 ', 'Satisfaction Item 2', 'Engagement Item 1', 'Engagement Item 2', 'Engagement Item 3', 'Engagement Item 4', 'Engagement Item 5', 'Motivation Item 1', 'Motivation Item 2', 'Motivation Item 3', 'Motivation Item 4', 'Performance Item 1', 'Performance Item 2', 'Leadership Item 1', 'Leadership Item 2', 'Leadership Item 3', 'Support Item 1', 'Support Item 2', 'Commitment Item 1', 'Commitment Item 2', 'Commitment Item 3', 'Commitment Item 4', 'Commitment Item 5', 'Diversity Item 1', 'Diversity Item 2', 'Diversity Item 3 (Reverse Coded)', 'Trust Item 1', 'Trust Item 2', 'Coworker Item 1', 'Coworker Item 2', 'Satisfaction Rank: Communication', 'Satisfaction Rank: Compensation', 'Satisfaction Rank: Coworkers/Peers', 'Satisfaction Rank: Management', 'Satisfaction Rank: Organizational Fit', 'Satisfaction Rank: Career Opportunity', 'Satisfaction Rank: Work Environment', 'Satisfaction Rank: Clear Job Expectations', 'Satisfaction Rank: Other (specify below)', 'How likely is it that you would recommend the Chicago Transit Authority to a friend or colleague?', 'Stay Intention: I am actively seeking another job in a different company/organization.', 'Stay Intention: I plan on working here for another (in years):', 'Stay Factor: Quality of Management', 'Stay Factor: Career Development', 'Stay Factor: Pay/Salary', 'Stay Factor: Coworker Relationships', 'Stay Factor: Grievance Handling', 'Stay Factor: Job Satisfaction', 'Stay Factor: Challenging Work', 'Stay Factor: Rewards & Recognition', 'Stay Factor: Safety', 'Stay Factor: Workload', '# of Safety Incidents', '# of Absent Days/Tardiness'] Predictor columns: ['Motivation Item 1', 'Motivation Item 2', 'Motivation Item 3', 'Motivation Item 4', 'Leadership Item 1', 'Leadership Item 2', 'Leadership Item 3'] Sample size after dropping missing values: 1485 Mean Tardiness: 0.37, Variance: 0.60 Formula: Q("# of Absent Days/Tardiness") ~ Q("Motivation Item 1") + Q("Motivation Item 2") + Q("Motivation Item 3") + Q("Motivation Item 4") + Q("Leadership Item 1") + Q("Leadership Item 2") + Q("Leadership Item 3") Optimization terminated successfully.
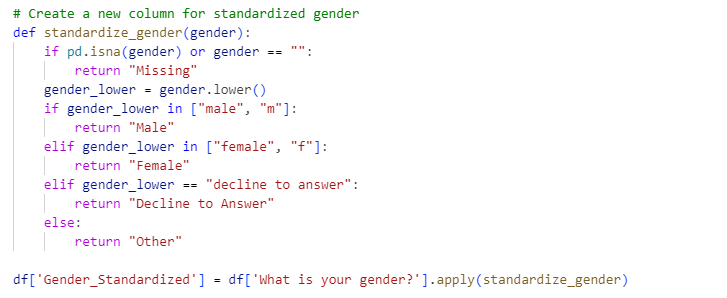
Stardandizing Variables
In the dataset, some variables contain multiple values for each concept. Therefore, I decided to standardize these variables before visualizing them. I observed this problem in the Race and Gender valiables.
Gender Standarzation
The gender column contained inconsistent entries ("Male", "M", "Female", "F", "Decline to answer", and empty strings). Standardizing ensures uniformity for analysis and reporting.
I decided to Mapped "Male" and "M" to "Male", "Female" and "F" to "Female" to consolidate variations. Then, I retained "Decline to Answer" as a distinct category to respect respondents’ privacy choices.Additionnaly, I assigned missing or empty values to "Missing" to explicitly track incomplete data and added an "Other" category to capture any unexpected entries.
I used a custom function with pandas’ apply to convert values based on case-insensitive matching.
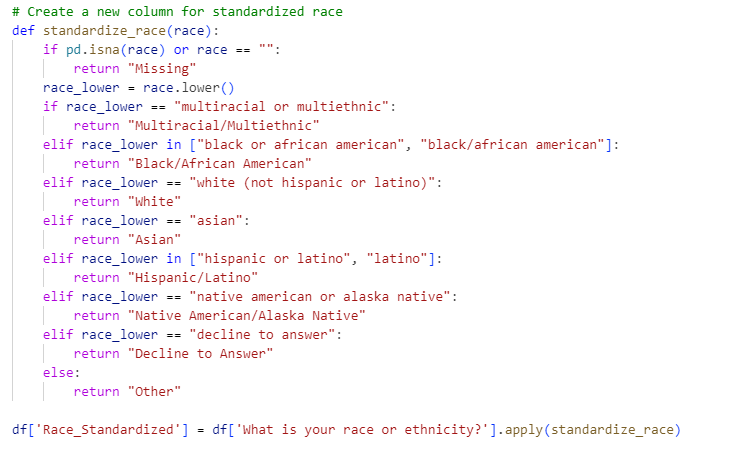
Race Standardization
The race/ethnicity column had varied formats and overlapping categories (e.g., "Hispanic or Latino" and "Latino"). Consolidation simplifies analysis and reduces redundancy.
I stated to combine "Black or African American" and "Black/African American" into "Black/African American", renam "White (Not Hispanic or Latino)" to "White" , merged "Hispanic or Latino" and "Latino" into "Hispanic/Latino" and retained "Multiracial or Multiethnic", "Asian", "Native American or Alaska Native", and "Decline to Answer" as distinct categories. Additionally, I assigned missing or empty values to "Missing", and included an "Other" category for any unanticipated values.
Power BI Dashboard Analysis Report: Transit Agency Employee Retention Initiative
As part of the transit agency’s employee retention initiative, I developed a Power BI dashboard to analyze a dataset of 1,227 employee responses collected as of June 19, 2025.
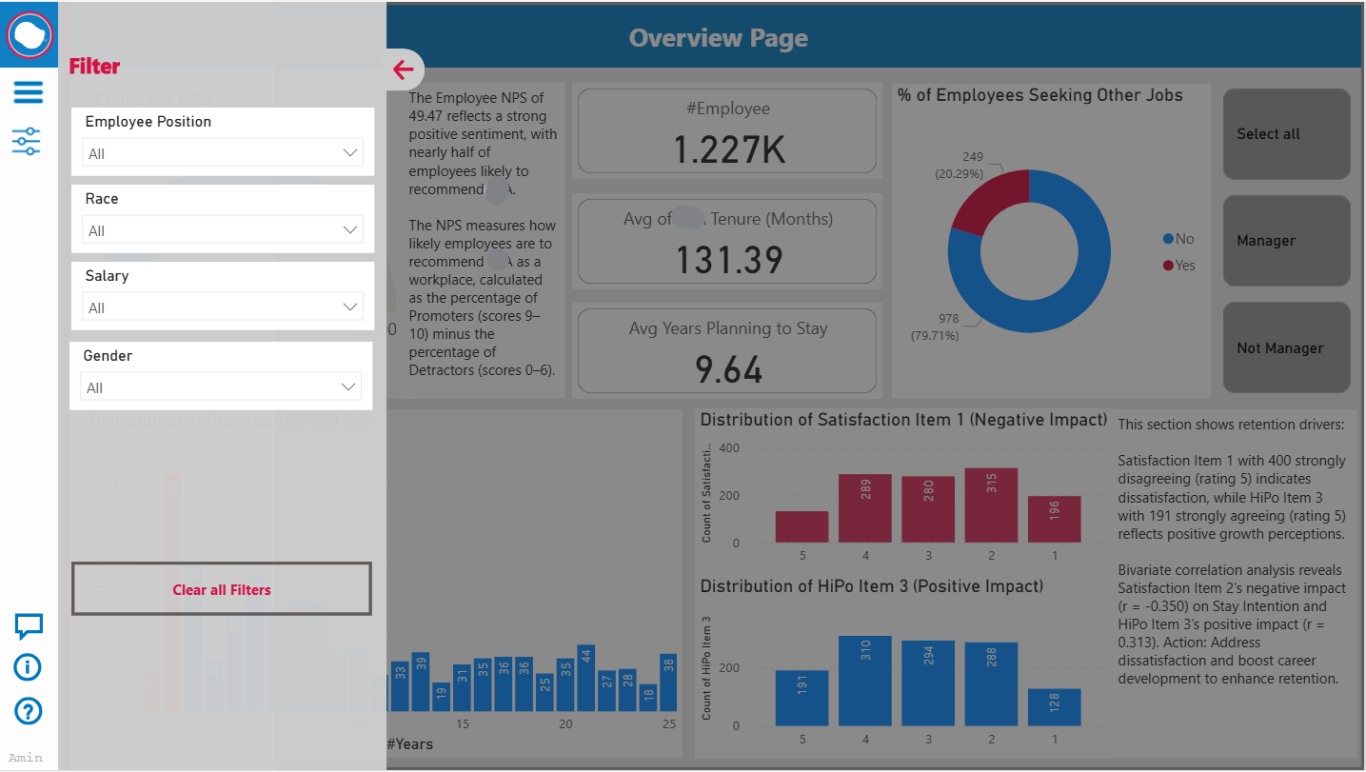
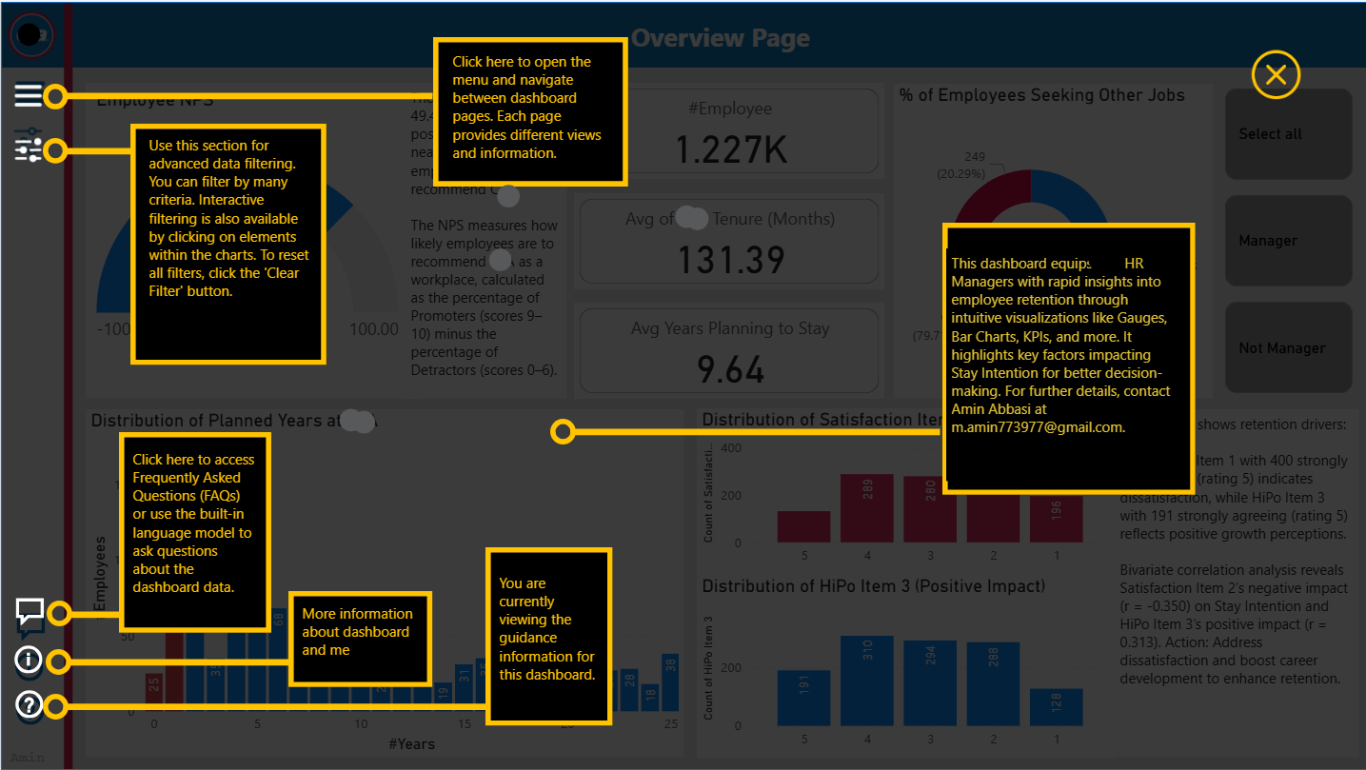
The dashboard is designed with a strong emphasis on user-friendliness to support managers—non-data experts—who are tasked with shaping retention strategies. Key design features include an embedded menu bar for navigation, a filter panel for data segmentation, a Q&A section for interactive querying, and a guidance page accessible via the left sidebar on every page.
To address the breadth of managerial interests, the data is strategically distributed across two pages: the Overview Page and the Analyzing Exodus Page. Below, I provide a detailed analysis of each dashboard screenshot.
Design Rationale
I designed this dashboard as a user-friendly interface to provide managers with a comprehensive snapshot of employee sentiment and retention metrics. The left sidebar includes an embedded menu bar with options to navigate between the Overview Page and Analyzing Exodus Page, ensuring seamless access to all sections.
A filter panel adjacent to the menu allows users to segment data , enabling targeted analysis.
A Q&A section at the bottom left offers an interactive tool where managers can type natural language questions (e.g., "What is the average tenure?") to retrieve insights dynamically.
Additionally, a guidance page link in the sidebar provides contextual help, accessible on every page, to assist non-technical users in interpreting visuals. This holistic layout ensures managers can explore data intuitively.
Visualizations and Analysis
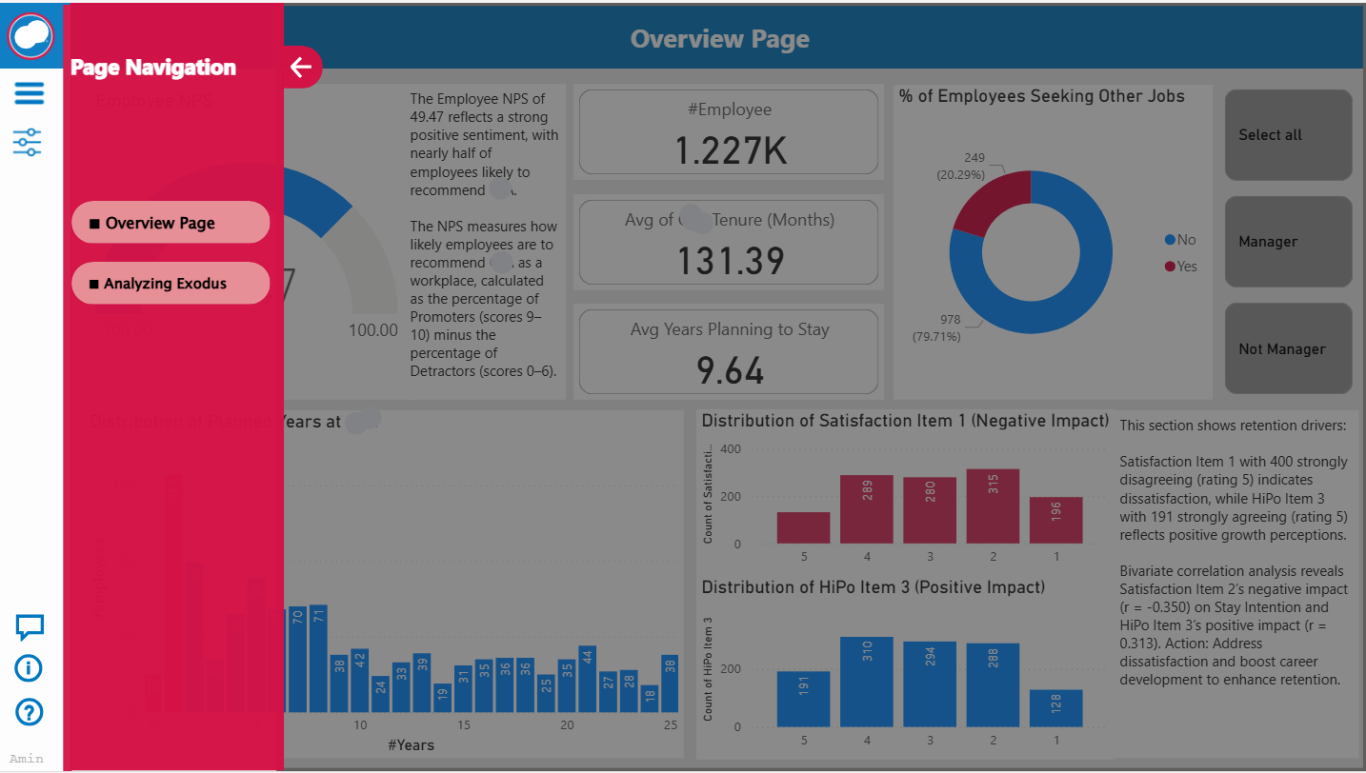
Overview Page of Dahsboard
Employee NPS (Net Promoter Score)
A semi-circular gauge displaying an NPS of 49.47. The NPS, derived from the “How likely is it that you would recommend the Chicago Transit Authority to a friend or colleague?” question, indicates a positive employee sentiment with 49.47% more promoters (scores 9–10) than detractors (scores 0–6). This is a robust score but falls short of the industry benchmark of 50+, suggesting potential for enhancement in workplace advocacy.
Implement targeted engagement initiatives, such as employee recognition programs, to elevate NPS above 50 and strengthen the agency’s employer brand.
# of Employees
A card showing 1,227 employees. This metric establishes the dataset’s scope, representing the total workforce analyzed, and serves as a denominator for other proportional metrics.
Avg of Tenure (Months)
A card indicating 131.39 months (approximately 11 years). The average tenure reflects a stable workforce with a significant proportion of long-serving employees, suggesting strong organizational loyalty but also potential challenges in refreshing talent pipelines.
Avg Years Planning to Stay
A card displaying 9.64 years. This average stay intention aligns with tenure, indicating employees anticipate a continued commitment of nearly a decade, which supports retention stability.
% of Employees Seeking Other Jobs
A pie chart with 0.24% (3 employees) actively seeking employment. The minimal percentage suggests low immediate turnover risk; however, the departure of even a few employees from critical roles could disrupt operations.
Conduct exit interviews with these individuals to identify dissatisfaction drivers and address them proactively.
Distribution of Planned Years at company
A bar chart highlighting the frequency of planned years, with a peak around 5–10 years. The distribution indicates a balanced retention outlook, with most employees planning intermediate tenures, though fewer plan short (<5 years) or long (>15 years) stays.
Distribution of Satisfaction Item 1 and HiPo Item 3
Two bar charts comparing response distributions on a 1–5 scale. Satisfaction Item 1 shows a skew toward lower scores, indicating dissatisfaction (possibly with communication or support), while HiPo Item 3 (e.g., self-efficacy) shows higher scores, reflecting positive perceptions of potential. Investigate low satisfaction scores through follow-up surveys and leverage high-potential perceptions to enhance engagement programs.
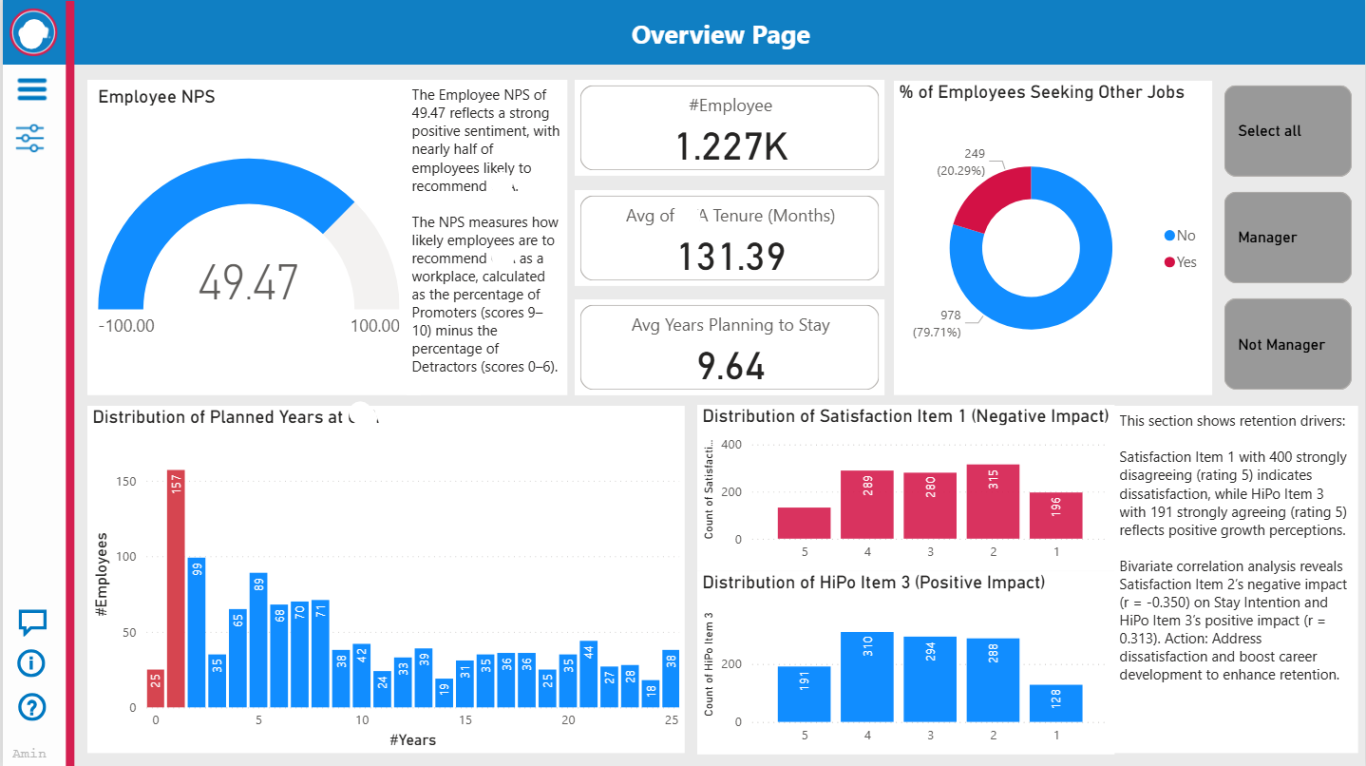
The Overview Page consolidates critical retention metrics, offering managers a foundational understanding of employee sentiment and stability. The user-friendly design, with accessible filters and guidance, empowers non-experts to derive actionable insights, such as prioritizing satisfaction improvements to bolster retention.
Analyzing Exodus Page
The Analyzing Exodus Page extends the dashboard’s functionality by focusing on turnover intent, complementing the Overview Page to meet managers’ diverse needs. The same user-friendly left sidebar includes the navigation menu, filter options, the Q&A section for ad-hoc queries, and a guidance page link for support. This consistent layout ensures managers can navigate and filter data effortlessly across pages. The page targets specific turnover drivers, such as age and salary, to provide deeper insights into retention risks.
# of Employees, Avg of Tenure (Months), Avg Plan on Work (in years)
Cards displaying 1,227 employees, 131.39 months tenure, and 9.64 years planned stay. These baseline metrics contextualize turnover analysis, confirming consistency with the Overview Page and highlighting a stable workforce with moderate future commitment.
Age vs. Planned Years at
A bar chart with planned years by age group (e.g., 18–30, 31–40), marked with red segments for employees seeking jobs. Younger employees (18–30) exhibit lower planned years and a higher proportion seeking jobs, indicating early-career instability. Older groups (51–60) show greater stability.
Develop mentorship or skill-building programs for the 18–30 age cohort to enhance retention and career progression.
Salary vs. Planned Years at company
A bar chart comparing planned years by salary range (e.g., $70K–$120K), with red segments for job seekers. Lower salary ranges ($70K–$90K) correlate with higher turnover intent, while higher ranges ($120K+) show stability, suggesting compensation influences retention.
Review salary structures for employees below $90K, considering adjustments or non-monetary benefits to reduce turnover risk.
Turnover Intent by Age Distribution
A pie chart showing turnover intent by age group (e.g., 18–30: 0.33%, 41–50: 0.00%). The 18–30 age group has the highest turnover intent (0.33%), while older groups exhibit none, reinforcing age as a retention risk factor.
Target retention strategies toward younger employees, such as flexible work arrangements or training opportunities.
Turnover Intent by Salary Distribution
A pie chart showing turnover intent by salary range (e.g., $50K–$90K: 0.33%, Above $120K: 0.00%). Turnover intent is concentrated in lower salary ranges ($50K–$90K), with none in higher ranges, aligning with the salary vs. planned years trend.
Address pay equity concerns in the $50K–$90K range to mitigate turnover among lower earners.
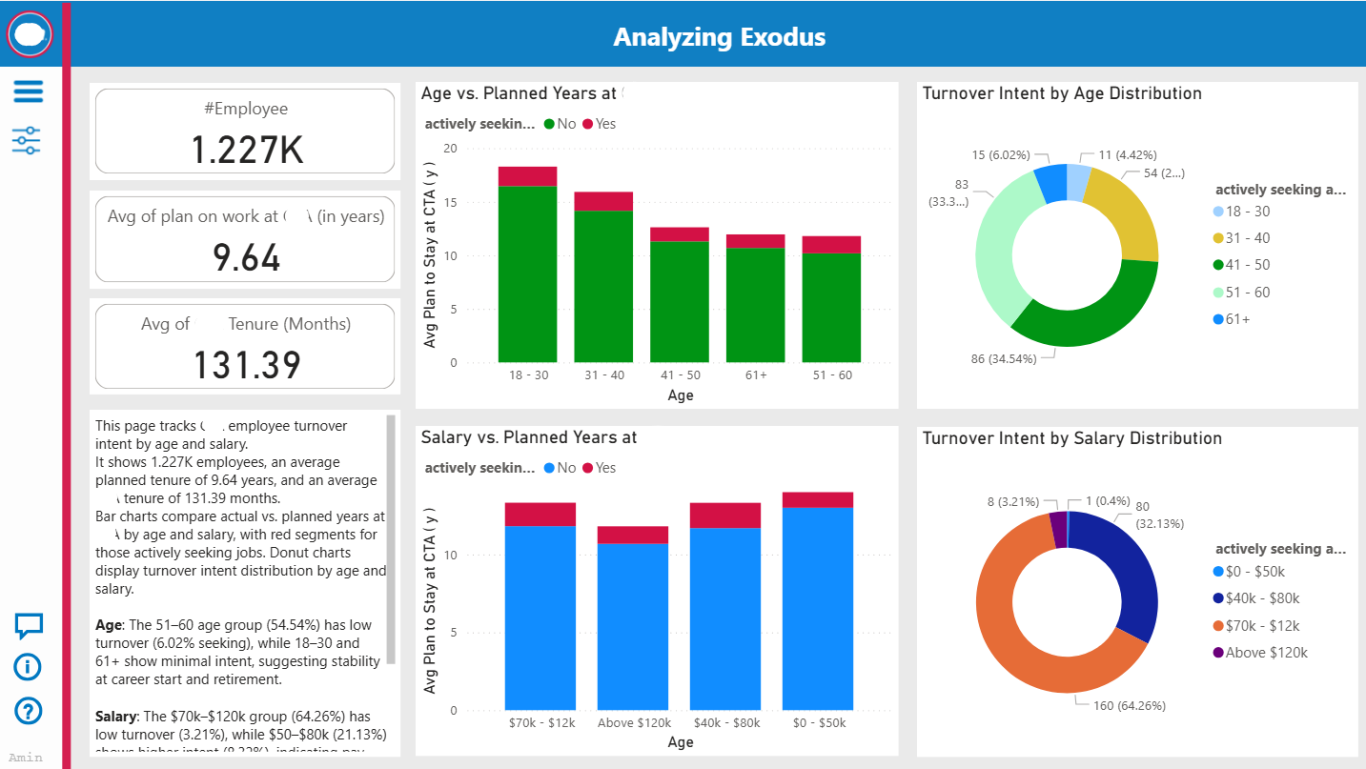
Page-Specific Insights
The Analyzing Exodus Page provides a granular view of turnover drivers, identifying younger and lower-paid employees as at-risk groups. The consistent user interface, with filters and guidance, enables managers to explore these insights and implement targeted retention strategies effectively.